 |
| Fig. 1 Totten Glacier Neighborhood |
I. Background
This series deals with deceitful doublespeak used to misinform the public about where they really are (You Are Here, 2, 3, 4, 5, 6).
We are told that Antarctica is so mysterious we have to look backwards a zillion and a half years to know what it will be like on the fourth of July next, but just looking at recent evidence is of no moment (The Ghost-Water Constant - 9).
Those who have read the textbooks created in the "it can't happen here age" will tend to still be thinking that it can't happen here (The Case for a Stable East Antarctic Ice Sheet: The Background).
Since reality is difficult to hide from competent scientists, the dire straits near Totten Glacier are now getting to be a hot item to study (Newsweek, Science Mag).
 |
| Fig. 2a WOD Zone 3612 |
 |
| Fig. 2b Another Way To Look At It |
 |
| Fig. 3a |
 |
| Fig. 3b |
 |
| Fig. 3c |
 |
| Fig. 3d |
 |
| Fig. 3e |
 |
| Fig. 3f |
I downloaded it and turned the TEOS-10 toolkit loose on it.
Today, let's look at Totten Glacier through those TEOS-10 eyes.
II. Back To Reality At Totten
The graphs at Fig. 1 and Fig. 2a - Fig. 2b give a picture of where Totten Glacier is located.
Conventional lack of wisdom misinforms us that since Totten and its ilk are far away and stable, so "nothing to see here folks, move along and go shopping."
Besides, it takes really, really warm or hot water to melt glaciers like Totten, so there is nothing to be concerned about.
Or, as the Preznit says, "Jiner thought up climate change so they could have bigly military parades."
III. Graphed Melt At Totten
As the eyes of TEOS-10 inform us, we have not yet warmed up to the cold reality of glacial melt at the grounding line and above it.
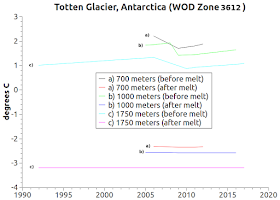
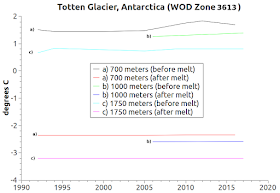
The graphs at Fig. 3a - Fig. 3f detail the melting points of the ice at the face of the Totten tidewater glacier.
The water that is melting that ice, and has been for over a hundred years, is deadly cold, but not as cold as it once was.
Atmospheric Ice Sheet Melt started a couple of decades or so after the industrial revolution began circa 1750 (see e.g. Weekend Rebel Science Excursion - 54, Questionable "Scientific" Papers - 3).
IV. More About The Graphs
Notice that the temperature, salinity, and depth / pressure determine melt conditions.
Also notice that the seawater doing the melting is extremely cold, BUT, it is not as cold as the ice is because "three-quarters of that [ocean] heat uptake [from global warming] occurs in the Southern Ocean" (Antarctica 2.0 - 3).
So, obeying the second law of thermodynamics, the less-cold stuff in the seawater flows into the more-cold glacier ice stuff, and when that dynamic is fully complete, we have very cold melt water.
I graphed the WOD Zones at and around Totten Glacier (WOD Zones 3611, 3612, and 3613) after applying the TEOS-10 toolkit to them.
The data in the WOD was not as robust as it is in other areas, so the SOCCOM data carried the day.
You can see that the temperatures vary with depth, as does salinity and pressure (measured in dbars).
V. The Bad News
Obviously it is not good news that it does not take much heat-transfer, under proper thermodynamic conditions, to melt glacial ice at or near the grounding line.
However, stopping the melting dynamic means stopping fossil fuel use and thereafter waiting an unknown amount of time for the ocean to "cool off" back to normal.
In the mean time the sea level will continue to rise until the melt stops.
VI. Conclusion
Science is only good for society when society heeds the "heads up" that science provides.
The next post in this series is here, the previous post in this series is here.
No comments:
Post a Comment