 |
| Fig. 1 Speed bumps |
I. Enthalpy
Let's talk about glacial melt rates impacted by "enthalpy".
I want to present a hypothesis of speed changes during the melting of tidewater glaciers like Totten in East Antarctica (Fig. 1).
The speed changes take place during the trip from position "D" (grounding line) to position "A" (far inland from position "D") caused by pressure / depth changes in "heat energy" (specific enthalpy) as discussed in a previous Dredd Blog post (see On Thermal Expansion & Thermal Contraction - 39).
The basic hypothesis, all things being the same, is that enthalpy increases the speed of
 |
| Fig. 2a |
 |
| Fig. 2b |
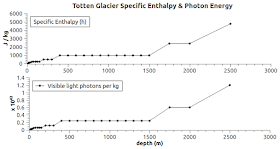
The graphs at Fig. 2a and Fig. 2b show how J / kg (Joules per kilogram) increases as depth (and therefore pressure) increases.
The graph at Fig. 3 shows equivalent visible light (e = 6 x 10⁻⁷ J per photon) energy in the specific enthalpy.
When the grounding line moves from position "D" to position "C" the pressure increases as the depth below sea level increases (Fig. 1).
The inverse is also true, as depth and pressure decrease, so does the "heat energy" (J / kg).
So, per the hypothesis the depth and pressure decrease as the grounding line moves from point "C to point "B" and then on up to point "A", thus the speed of melt will likewise decrease.
II. Unknowns
How much speed change will take place is not really knowable, except when all other factors have been quantified, which is not that easy to do:
"Rapid retreat of tidewater glaciers can be initiated when the front is perturbed from a preferred pinning point, particularly when the glacier sits in an overdeepened trough. This is believed to make certain areas of ice sheets particularly vulnerable to ice loss. A number of factors may cause a previously stable front position to become unstable, including changes in buttressing provided by an ice shelf, and changes in ocean temperature."(Hydrologically-induced slow-down, emphasis added). The test would be to determine all factors just prior to the grounding line going over the top of a ridge and beginning the descent into the valley.
 |
| Fig. 3 Equivalent visible light photon energy |
The graphs show: 1) a fixed value flow, 2) increasing salinity with depth, and 3) a temperature increase with depth.
The no-changes line in Fig. 2a (black line) is for the most part imperceptible because it has almost the same set of values as the salinity (green line).
The notable issue is that the temperature line in both graphs is more significant than the salinity line.
That means that temperature is second in importance, but the prime factor is pressure / depth.
III. Conclusion
Assume a case, then, where neither the temperature nor the salinity change during the melting from point "D" to point "C", that is, only the pressure changes (it increases).
That means more melt energy is projected against the subsurface ice face of the glacier because enthalpy increases, so melt increases.
But, as the grounding line passes point "C" and heads uphill to point "B" the pressure drops because the depth / pressure is decreasing.
This continues all the way up to point "A".
The consideration of enthalpy may help determine the retreat time line of tidewater glaciers.
The next post in this series is here, the previous post in this series is here.
"The Atlantic and Pacific Ocean hurricane season is most powerful on record this year" (link)
ReplyDelete